Intraday Stock Quotes n Charts 2.3.7
Free Version
Publisher Description
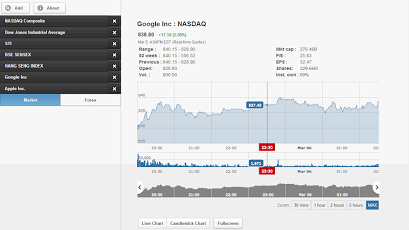
Make nearly accurate predictions and take firm decisions using the app's calculated measures (Pivot Point, Resistance Points and Support Points). A must have app for any investor who deals with any Stock market or Equity market or Forex around the world (for example Nasdaq). With this app installed, you don't need intraday tips for trading anymore.Intraday Stock Quotes n Charts a.k.a. Intraday Trend Indicator 2.3 also features most awaited Realtime Live Market & Forex Quotes for major exchanges.Along with Live Charts including Candlestick charts for Equities, Indices as well as for Forex.Pan & Zoom throughout the charts while the chart draws live points during active market sessions!Watch Candles form and slide in realtime for all major exchanges!Includes Equity information such as EPS, P/E Ratio and much more..Features :* Stocks and Indices from 80+ Global Markets.* Track Currency pairs between 90+ global currencies including all major Forex pairs.* Sub-Indices from nearly all Global Market Indices.* Includes Floor Pivots, Tom DeMark's Pivots, Woodie's Pivots, Camarilla Pivots as well as Fibonacci Pivots. * Realtime live quotes for Equities, Indices and Forex* Company information including EPS, P/E, MarketCap.* Realtime live charts including candlestick.* Optimized for Tablets and Wide screens.* Portrait mode & better UI for small screen devices.* Very low network usage. (Useful if your Cellphone Carrier charges you for data connection).* Simple and Sleek design.* Lightweight - Low memory requirements.Upcoming Features:* More technical indicator for graphs such as SMA, EMA and other technical levels.Please Note :This is an early release version. In case of any problems or bugs please report it on https://docs.google.com/spreadsheet/viewform?formkey=dGpDZWRQMWtaQnNCRldhZmpEWGs0Zmc6MA BUG REPORT FORM.For any other support or feature requests contact anupchaudhari@gmail.comIf you don't understand what this App is all about, Read below : In technical analysis, Pivot Points are used to determine sensitive trading levels at which the price trend is predisposed to change direction - possible support and resistance lines. Pivot Points are trend-predicting indicators (leading indicators) that are based on the average of the previous day's High (H), Low (L) and Close (C) prices. Here, "S" represents the support levels, "R" the resistance levels and "P" the pivot point. High, low and close are represented by the "H", "L" and "C†Pivot points can be used in two ways. The first way is for determining overall market trend: if the pivot point price is broken in an upward movement, then the market is bullish, and vice versa. Keep in mind, however, that pivot points are short-term trend indicators, useful for only one day until they need to be recalculated. The second method is to use pivot point price levels to enter and exit the markets. For example, a trader might put in a limit order to buy 100 shares if the price breaks a resistance level. Alternatively, a trader might set a stop-loss for his active trade if a support level is broken.A few tips :Price is bullish when trading above the pivot point.Price is bearish when trading below the pivot point.S1, S2 and S3 are important levels of support.R1, R2 and R3 are important levels of resistance.Trading Range S1-PP-R1 : Normal PositionTrading Range S2- PP - R2 : Oversold / Overbought PositionTrading Range S3- PP - R3 : Extremely oversold / Extremely overbought Position.Disclaimer :Invest at your own risk. Even though this app gives fairly accurate measurements, we are not responsible for any losses incurred to the user using this app.------------------------------------------------------------Keywords: Intraday,Pivot Point,Stock Market, NSE, BSE, Nifty, Nasdaq, Dow Jones, Resistance, Support, Trend, Woodie, Camarilla, Forex, Tom DeMark, Fibonacci, Equity, Realtime Quotes, Realtime Live Charts, Candlestick.
About Intraday Stock Quotes n Charts
Intraday Stock Quotes n Charts is a free app for Android published in the Other list of apps, part of Business.
The company that develops Intraday Stock Quotes n Charts is Bulls N' Bears. The latest version released by its developer is 2.3.7. This app was rated by 1 users of our site and has an average rating of 4.0.
To install Intraday Stock Quotes n Charts on your Android device, just click the green Continue To App button above to start the installation process. The app is listed on our website since 2013-04-02 and was downloaded 70 times. We have already checked if the download link is safe, however for your own protection we recommend that you scan the downloaded app with your antivirus. Your antivirus may detect the Intraday Stock Quotes n Charts as malware as malware if the download link to com.bullsnbears.trendindicator is broken.
How to install Intraday Stock Quotes n Charts on your Android device:
- Click on the Continue To App button on our website. This will redirect you to Google Play.
- Once the Intraday Stock Quotes n Charts is shown in the Google Play listing of your Android device, you can start its download and installation. Tap on the Install button located below the search bar and to the right of the app icon.
- A pop-up window with the permissions required by Intraday Stock Quotes n Charts will be shown. Click on Accept to continue the process.
- Intraday Stock Quotes n Charts will be downloaded onto your device, displaying a progress. Once the download completes, the installation will start and you'll get a notification after the installation is finished.
